Home price response
A heating setpoint for one home with an air-to-water heat pump and floor heating. It moves heat out of the hours when electricity costs the most and keeps the room inside its comfort band. Demand response programs add up many homes like this one. BOPTEST’s own controller holds the setpoint just above the comfort floor whatever the price.
Our own design, written for BOPTEST’s bestest_hydronic_heat_pump (a simulated home in
Brussels, heating only, prices in euros). It is not taken from any standard or library
sequence. It keeps no state: each step’s setpoint depends only on that step’s inputs. The
runtime passes BOPTEST’s forecasts in as inputs; every decision about them is made inside the
verified graph.
Interface
Section titled “Interface”| Point | Type | Meaning |
|---|---|---|
pri00..pri23 |
real inputs, per kWh | Electricity price for the current hour (pri00) and the next 23 hours |
TLo00..TLo02 |
real inputs, K | Lower comfort limit (floor) now, in 1 h and in 2 h |
THi00..THi03 |
real inputs, K | Upper comfort limit (ceiling) now and in 1, 2 and 3 h |
TZon |
real input, K | Room temperature now |
TSet |
real output, K | Heating setpoint |
Behavior in brief
Section titled “Behavior in brief”- Peak-price hours: an hour is peak-price when its price is at least 75 % of the way from the day’s lowest to highest price (and the day’s prices differ by more than 0.01 per kWh).
- Normal: 0.2 K above the comfort floor, never below 20.5 °C, and already up for a floor rising within 2 h.
- During a peak-price hour, coast: drop 1.5 K below base, but never below the coming floor plus 0.1 K.
- Before a peak-price hour (within 3 h), preheat: normal plus 1 K, capped 2 K below the coming ceiling, and skipped if the room is already more than 0.5 K above normal.
- A peak-price hour now takes precedence over one coming.
Validation
Section titled “Validation”- 22 scenarios from the independent reference model: flat days, peaks now and coming while occupied and away, a peak just beyond the look-ahead, an already-warm room, dropping ceilings, arrivals and departures around a peak, the threshold edge, and a forecast rolling through a peak.
- A 33-block hand-built graph (using
Reals.MultiMaxandReals.MultiMinover the hourly values) passes all 22; 21 deliberate mistakes each fail at least one.
How it did
Section titled “How it did”- Muse Spark: first try 3 of 3, 17 of 17 scenarios each (the run used the first 17; re-scoring the same replies against all 22 changed no verdict). An easy spec: no timers, no stored values, and the task states each formula. It shows the new width blocks are usable, not that the model is strong on hard sequences.
- Live on BOPTEST through the runtime (
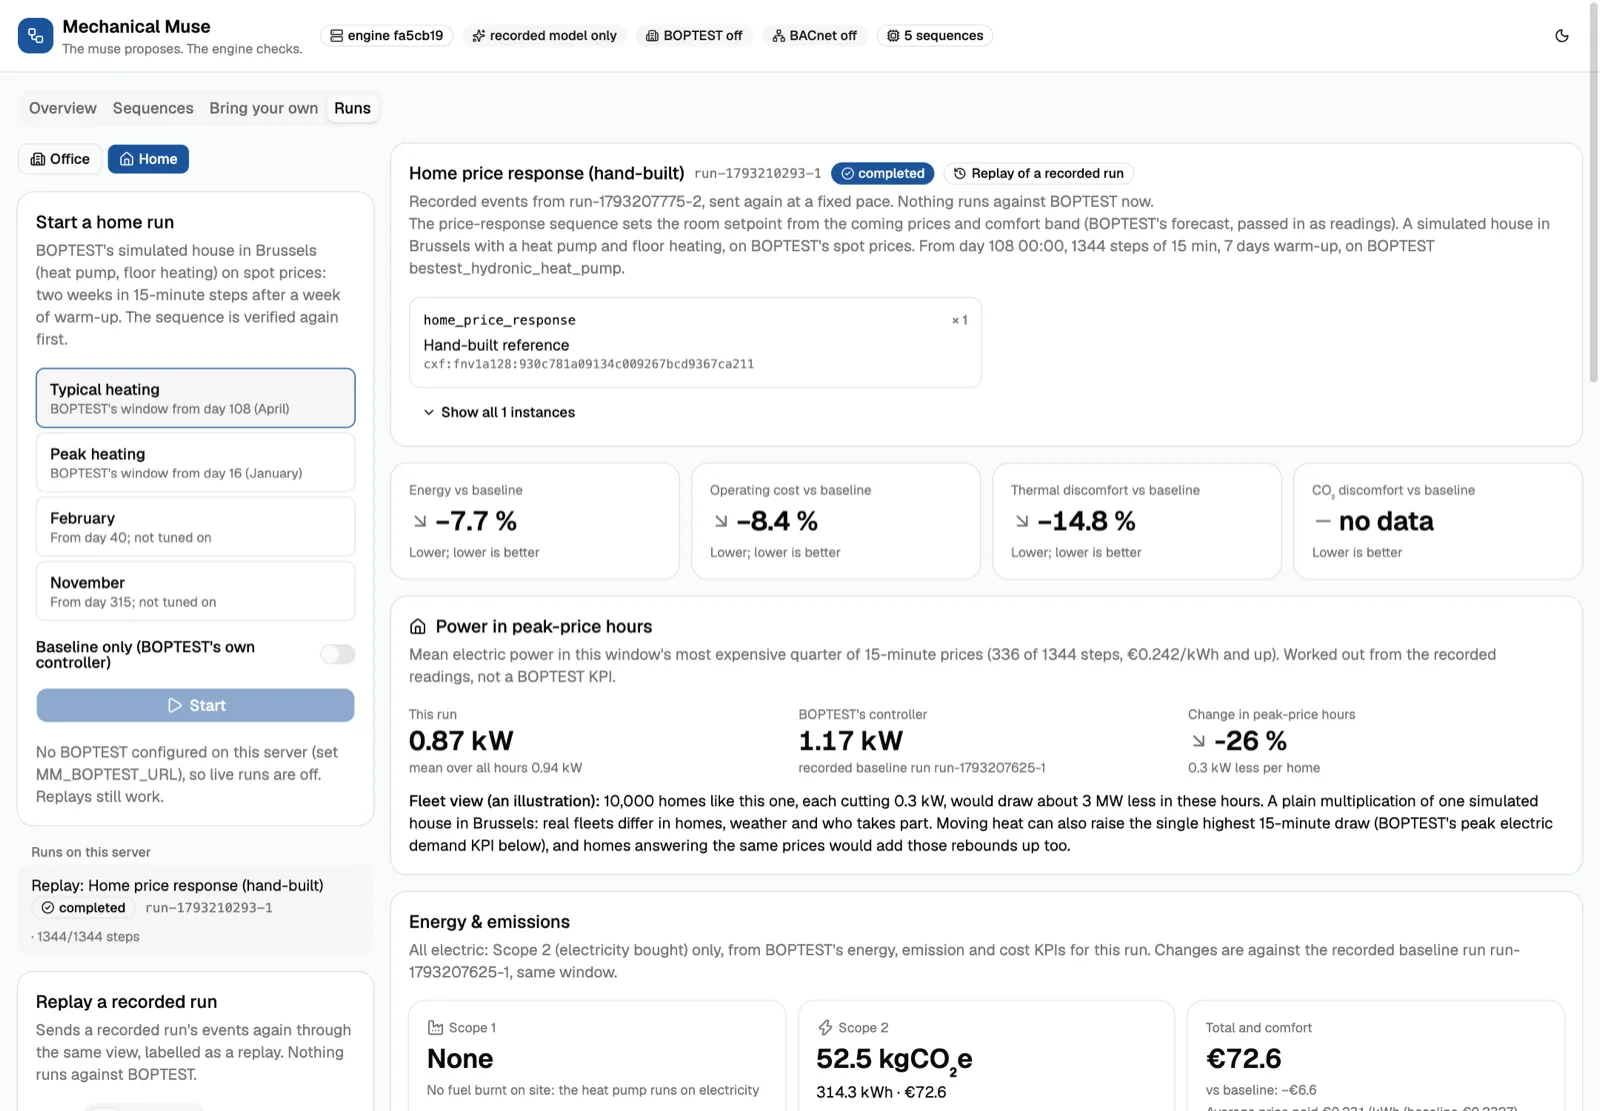
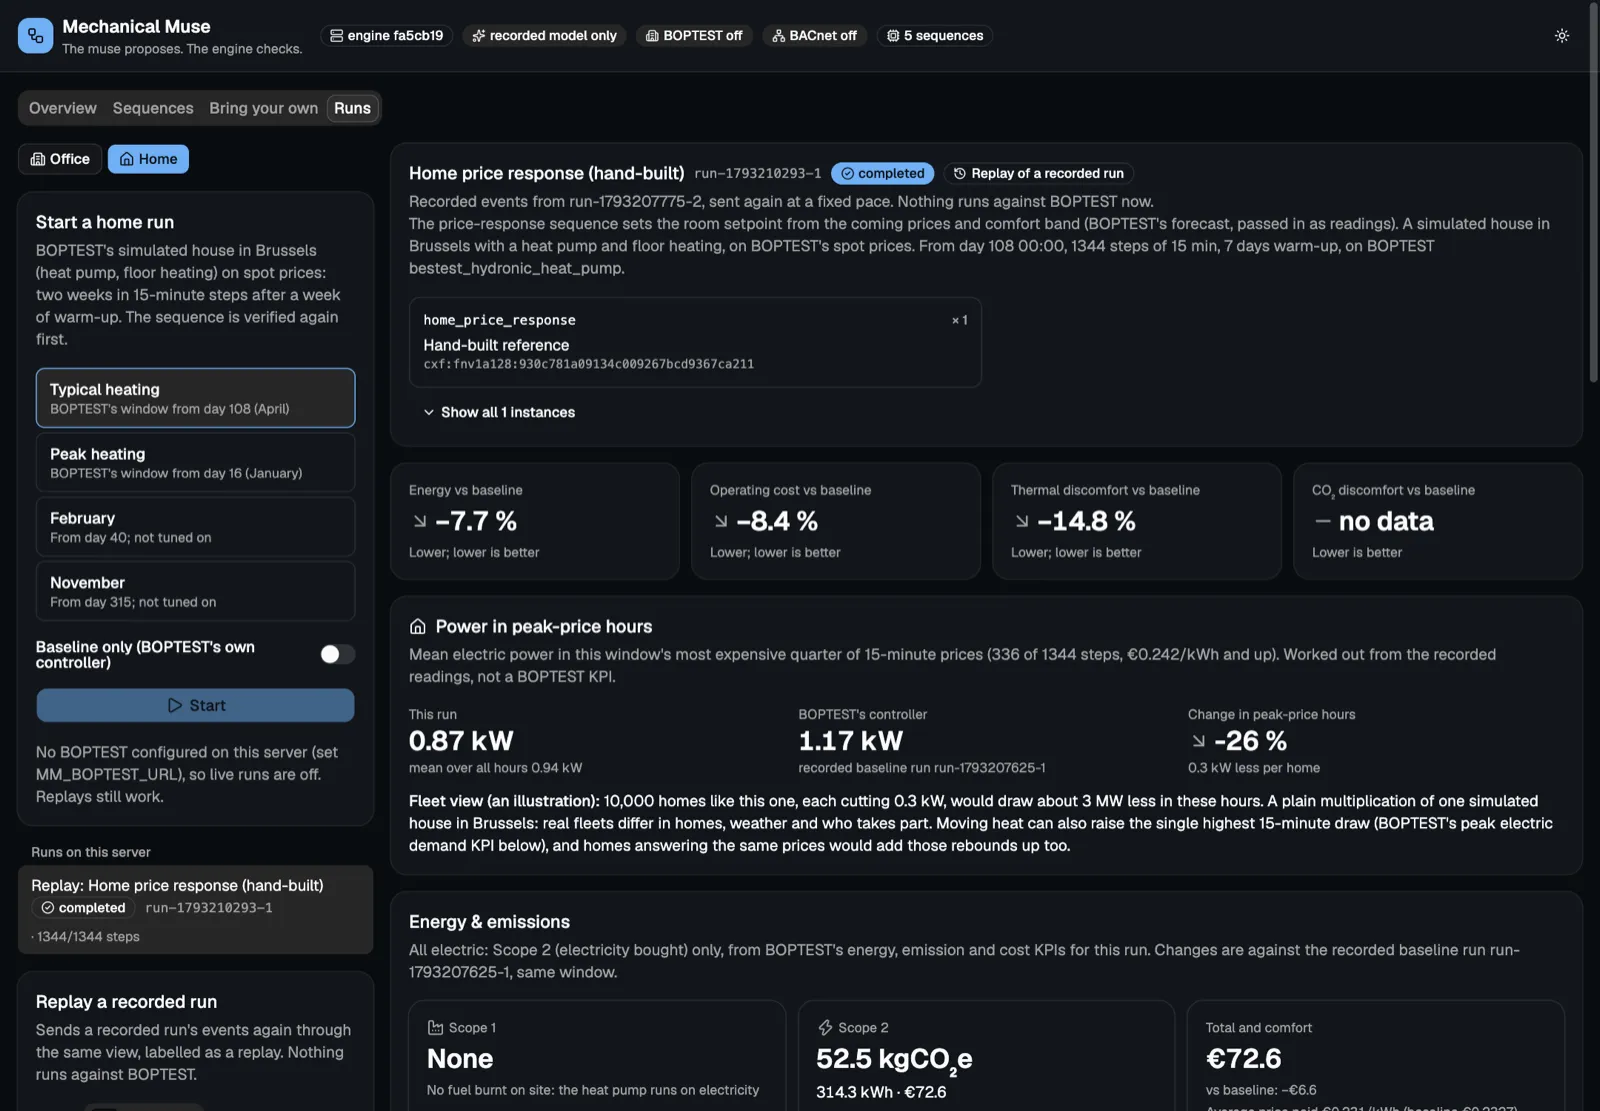
building: home), two weeks per window against its own controller: typical heating cost −8.4 %, discomfort −14.8 %, power in the most expensive quarter of prices 1.17 → 0.87 kW (−26 %); peak heating −8.3 %, −81.9 %, 1.63 → 1.03 kW (−37 %). Every setpoint matched the independent reference. BOPTEST’s peak demand KPI rose (+16 %, +4 %): heat moved into higher spells before the expensive hours. See Runtime results. - On two windows it was not tuned on (from days 40 and 315), live through the runtime: cost −6.9 % and −6.0 %, discomfort −45 % and −72 %, peak-price power −34 % and −24 %.
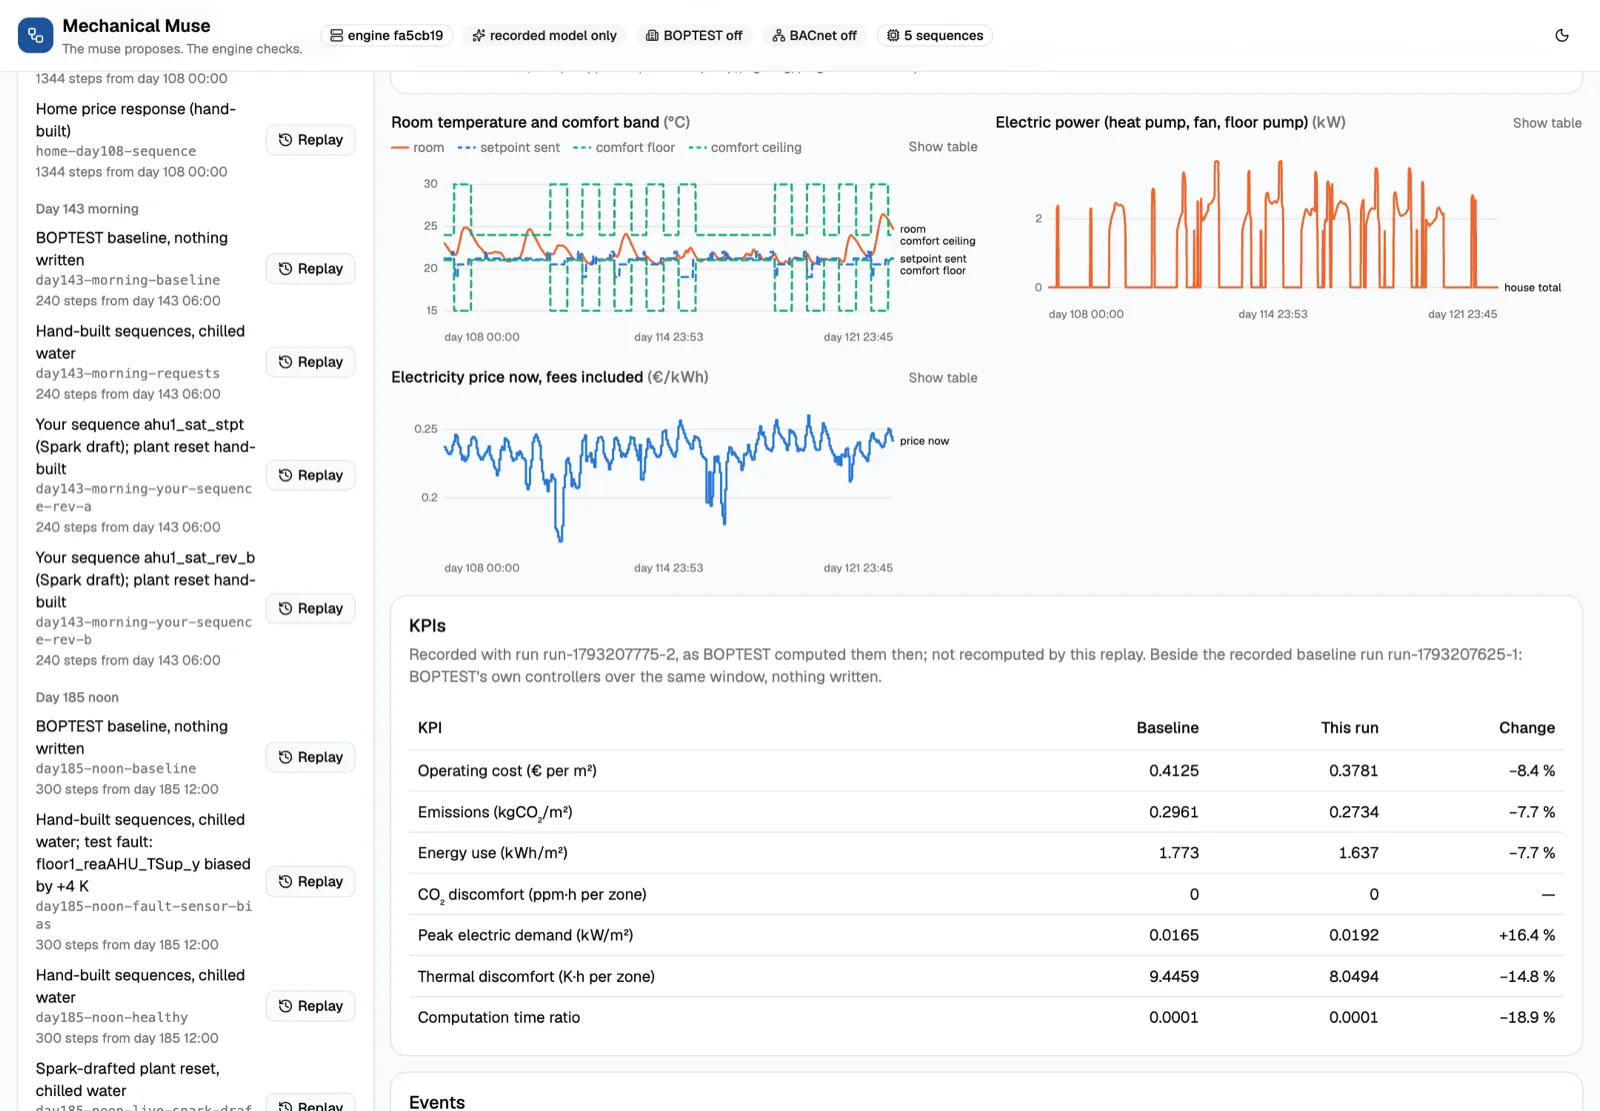
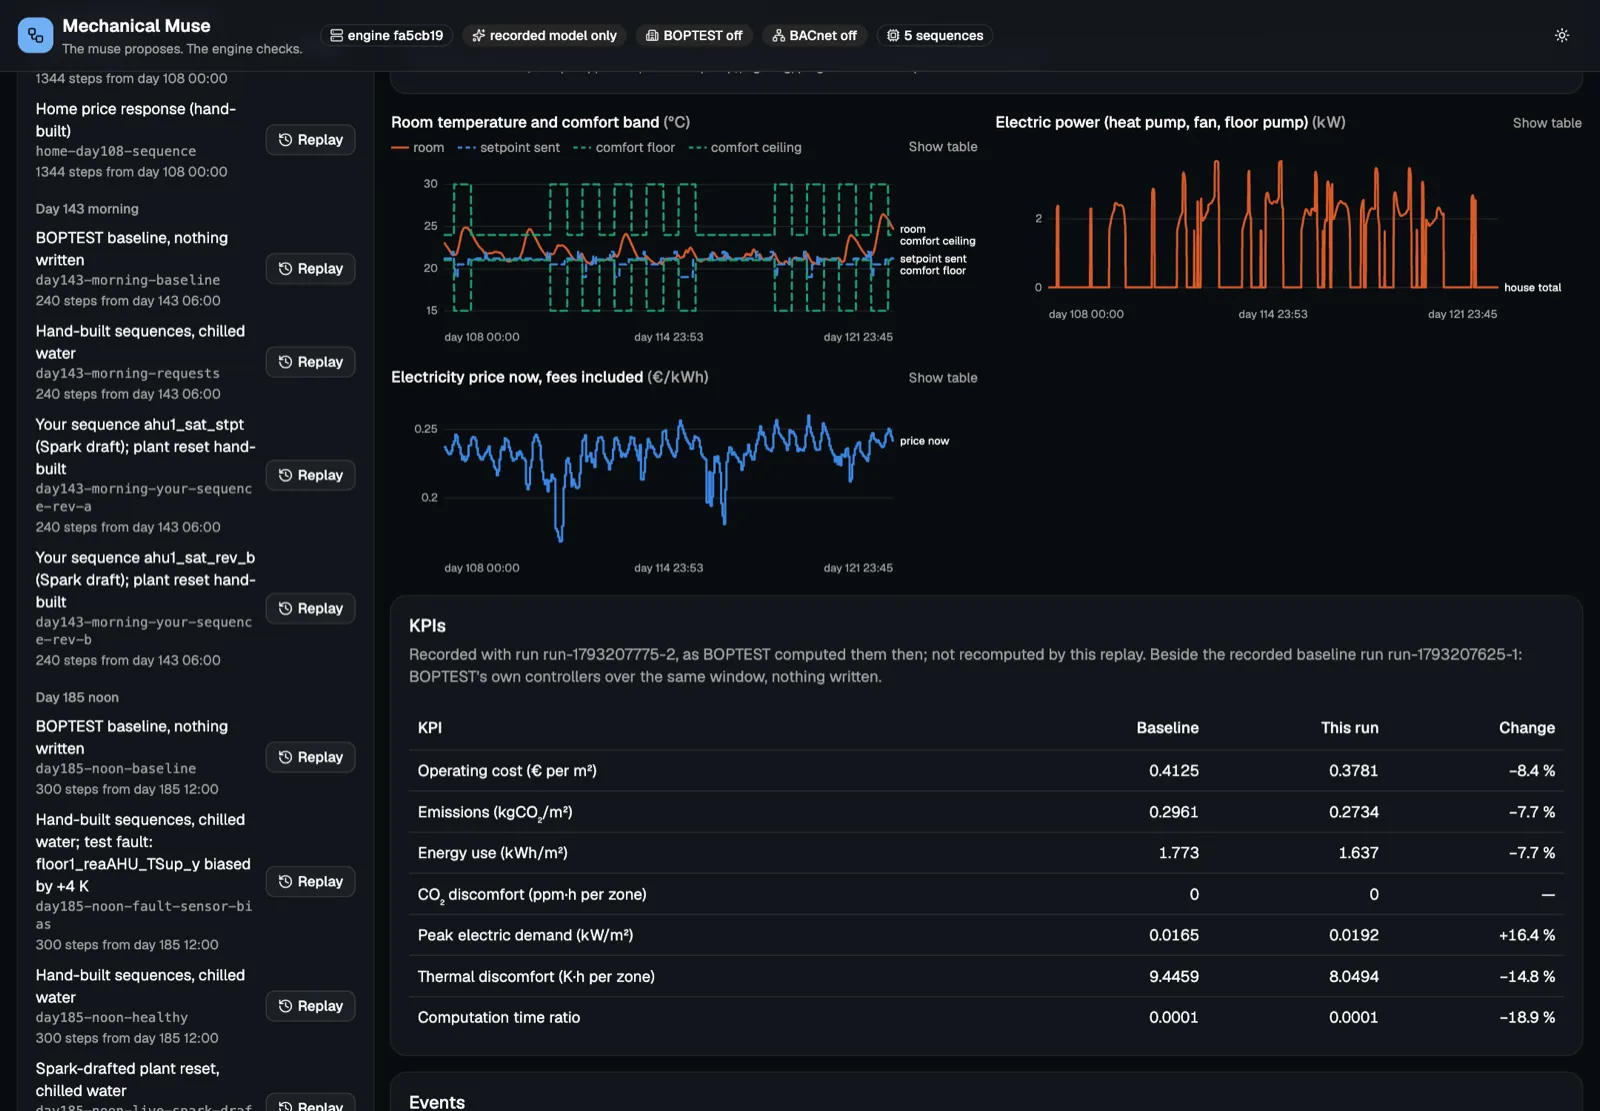
Prices in this building swing little (with fixed fees, about €0.17 to €0.26 per kWh in the typical window, €0.22 to €0.32 in the peak one), so the per-home saving is small; the point is the power moved out of peak-price hours. The fleet view in the app (10,000 such homes) is a plain multiplication and an illustration, not a forecast.
Full spec: specs/home_price_response/spec.md