Emissions ledger
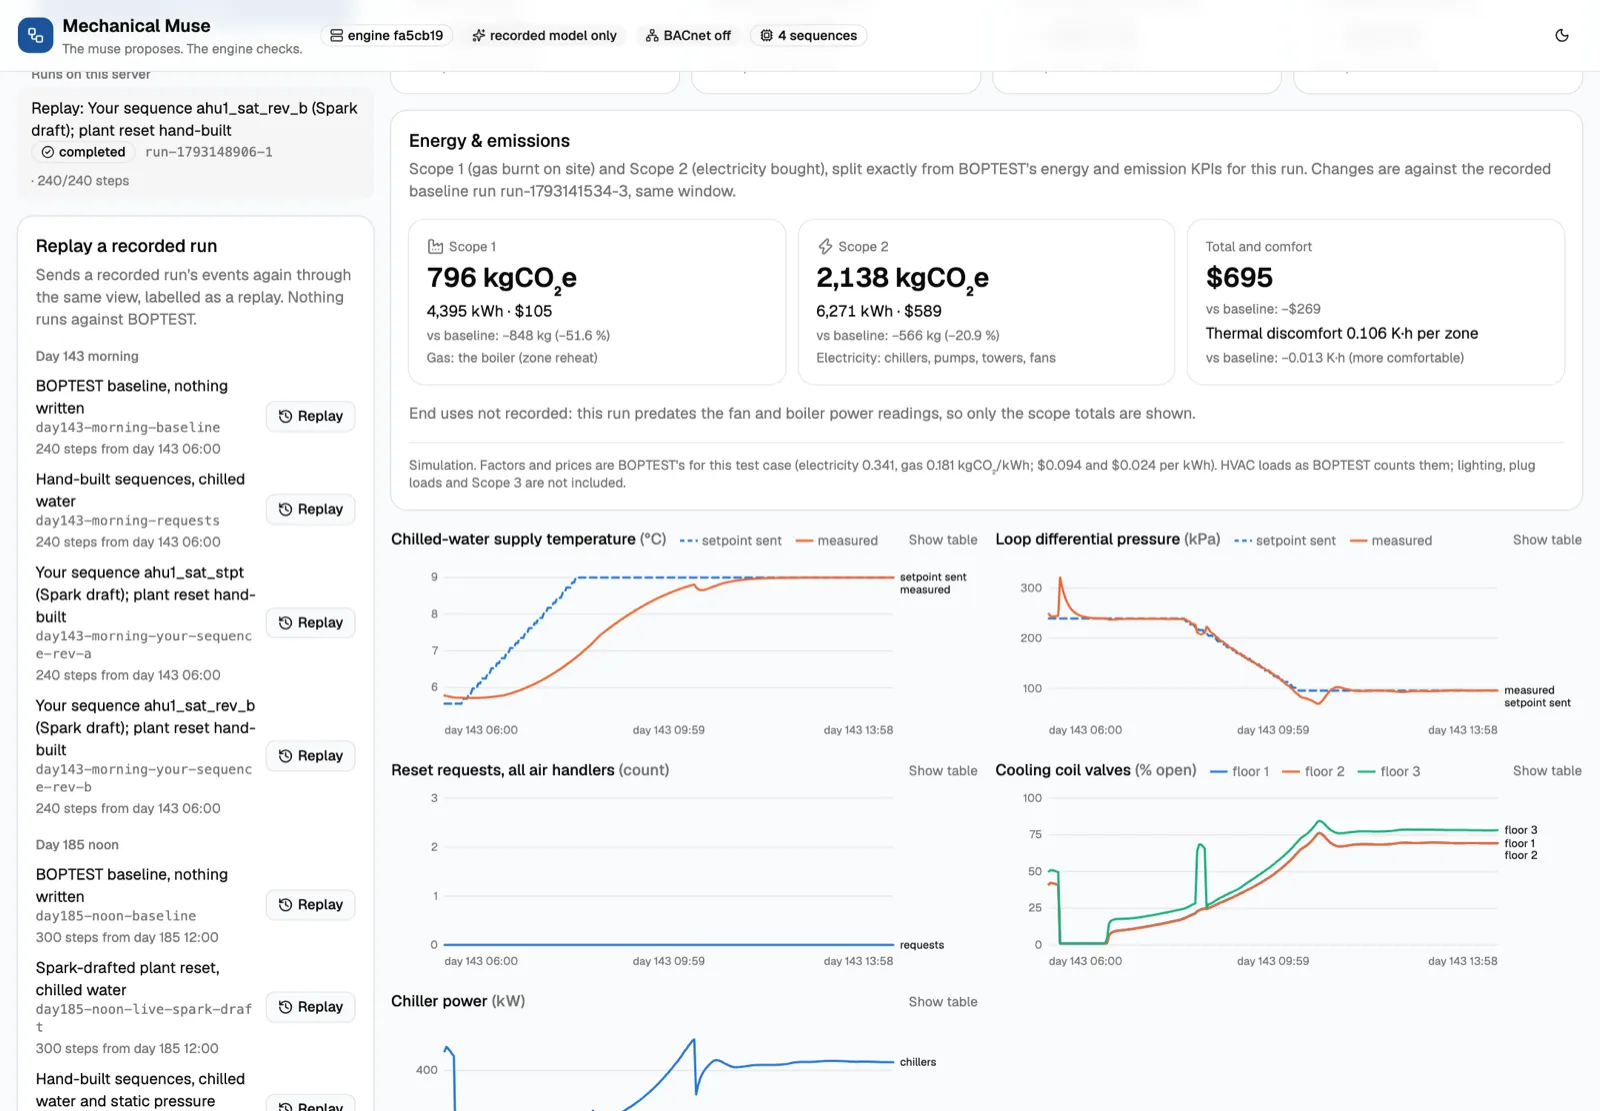
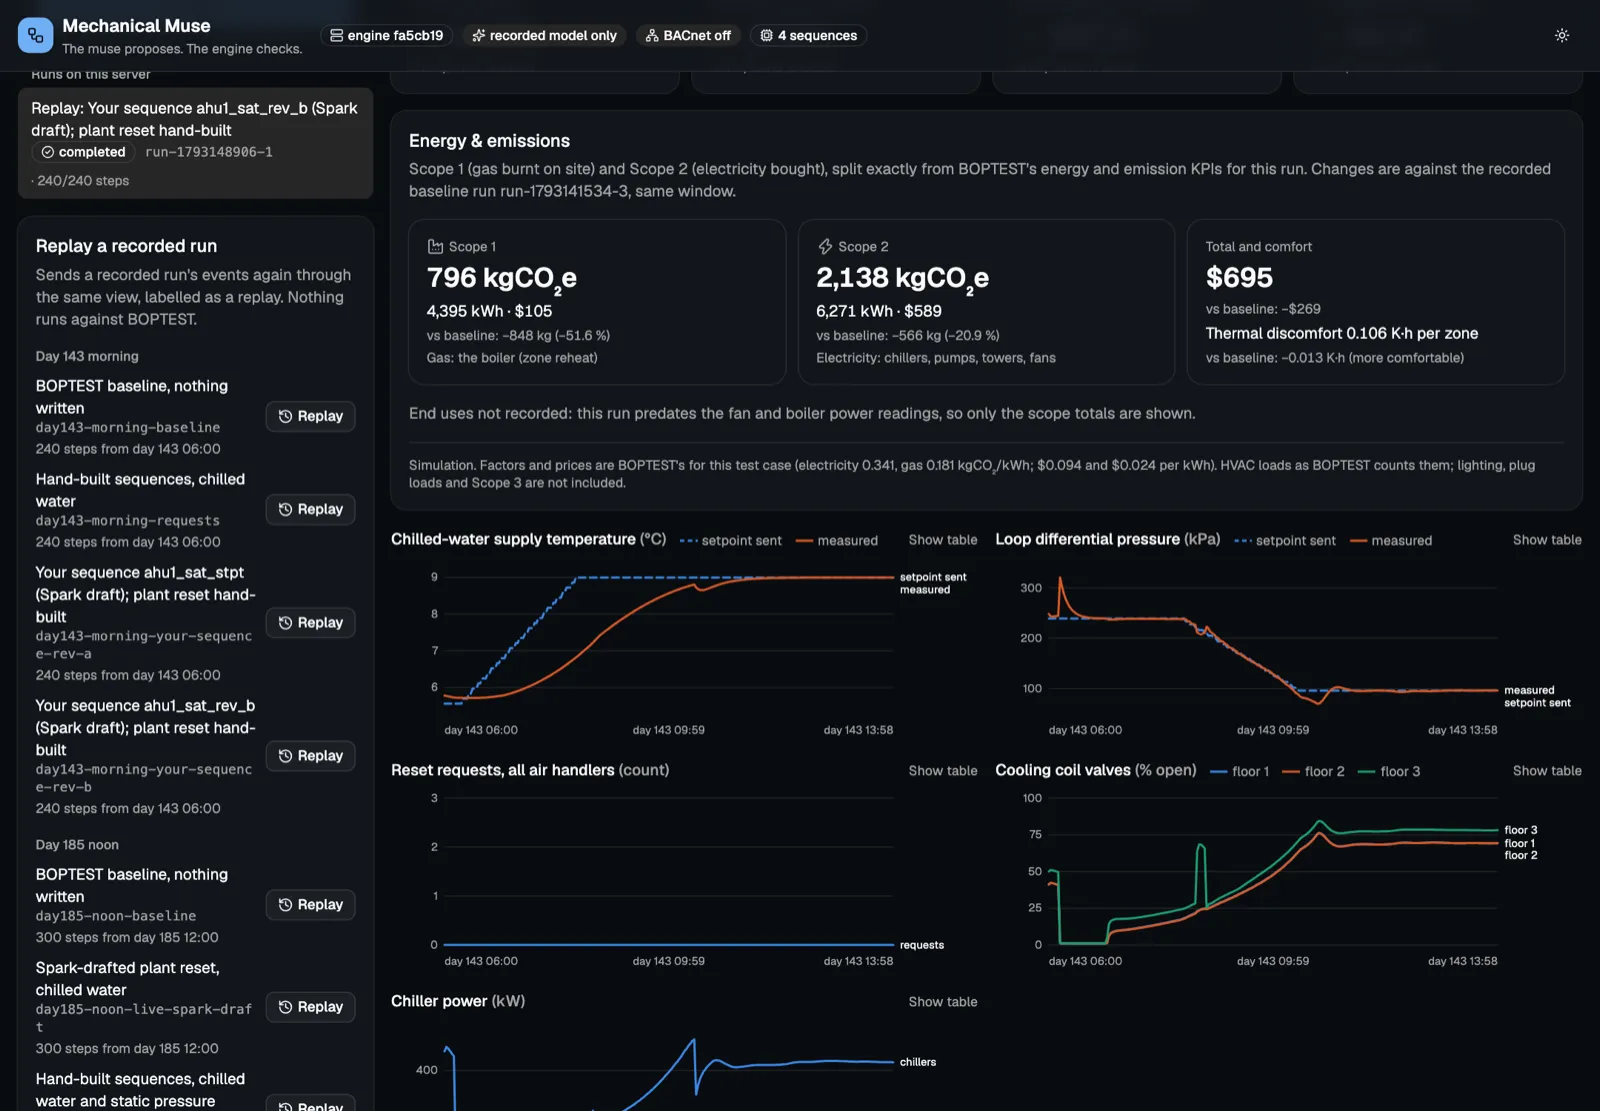
Every BOPTEST run, live or recorded, gets a ledger: the HVAC plant’s energy, the emissions it stands for, and its cost, split into Scope 1 (gas burnt on site, the boiler) and Scope 2 (electricity bought: chillers, pumps, towers, fans). Two runs of the same window can be compared. Nothing reads these numbers to decide a control action.
Method
Section titled “Method”- Scope totals are exact. BOPTEST reports total energy and total emissions. Its emission factors for this test case are constant, so the two totals give two linear equations in electricity and gas, and the split is exact. Re-pricing the split must give back BOPTEST’s own cost KPI; every committed recorded run does.
- End uses come from the 14 power readings the runtime records each 120 s step, integrated the way BOPTEST’s KPI calculator does. What 120 s samples cannot see lands in an “unattributed” row, so each scope’s rows still add up to its exact total.
- Factors and prices are BOPTEST v0.9.0’s for this test case: 0.341 kgCO2/kWh electricity, 0.18108 kgCO2/kWh gas, $0.094/kWh and $0.024/kWh (constant price scenario only).
What a fault costs
Section titled “What a fault costs”A run with a labeled test fault is priced against its twin: the same window and settings without the fault.
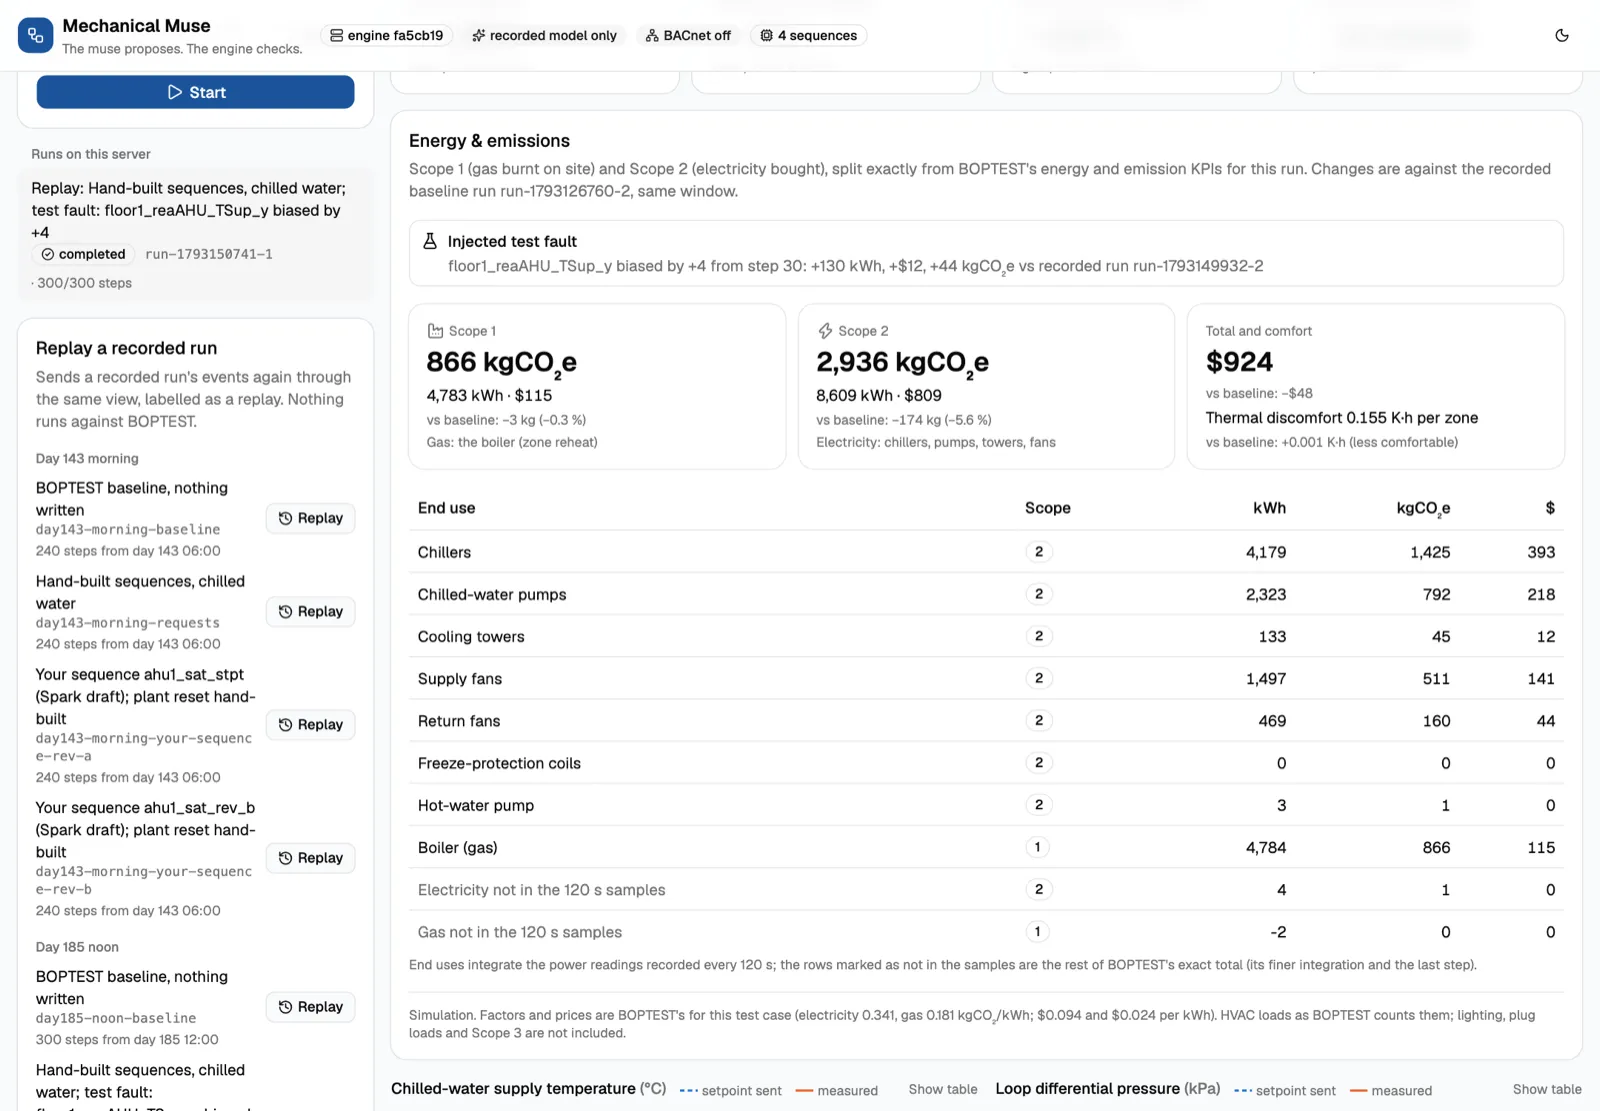
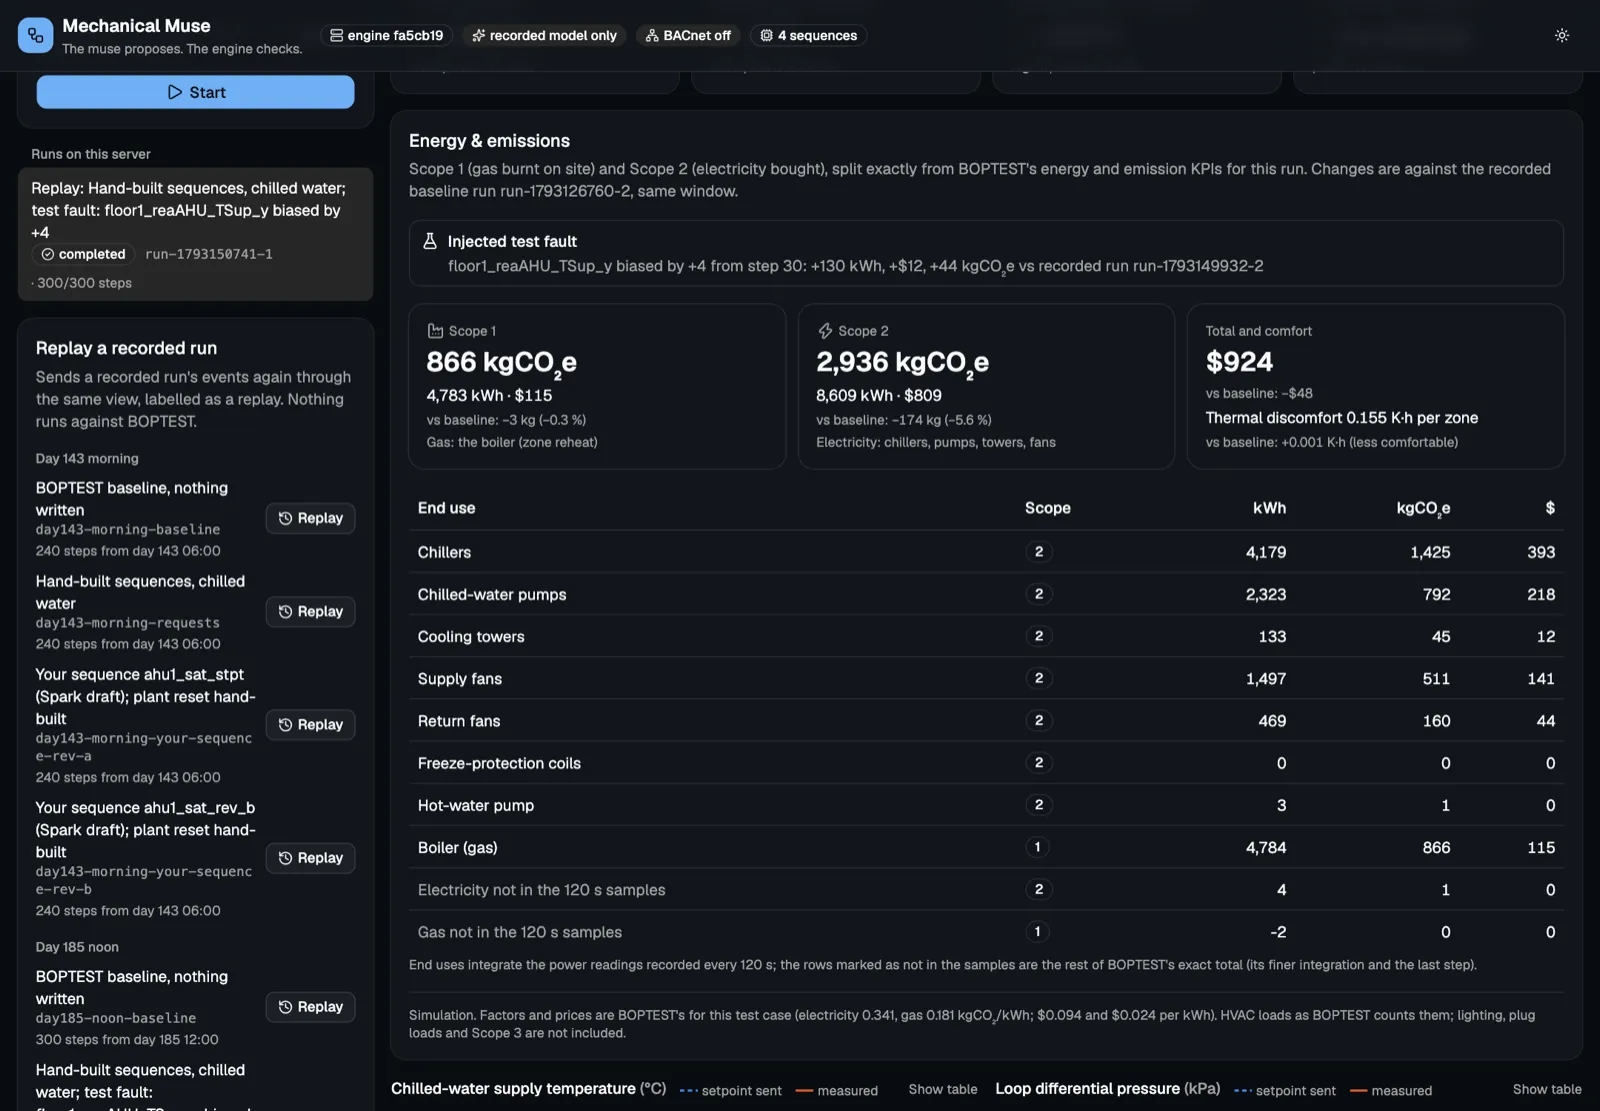
On day 185 from noon (10 h), a 4 K high bias on floor 1’s supply-air reading for 2 h made the plant reset drive the chilled water to its cold end: +130 kWh, +44 kgCO2e and +$12.25, nearly all chiller electricity. That is about a fifth of the ten hours’ saving against BOPTEST’s baseline. One window, one fault, in simulation.
The home
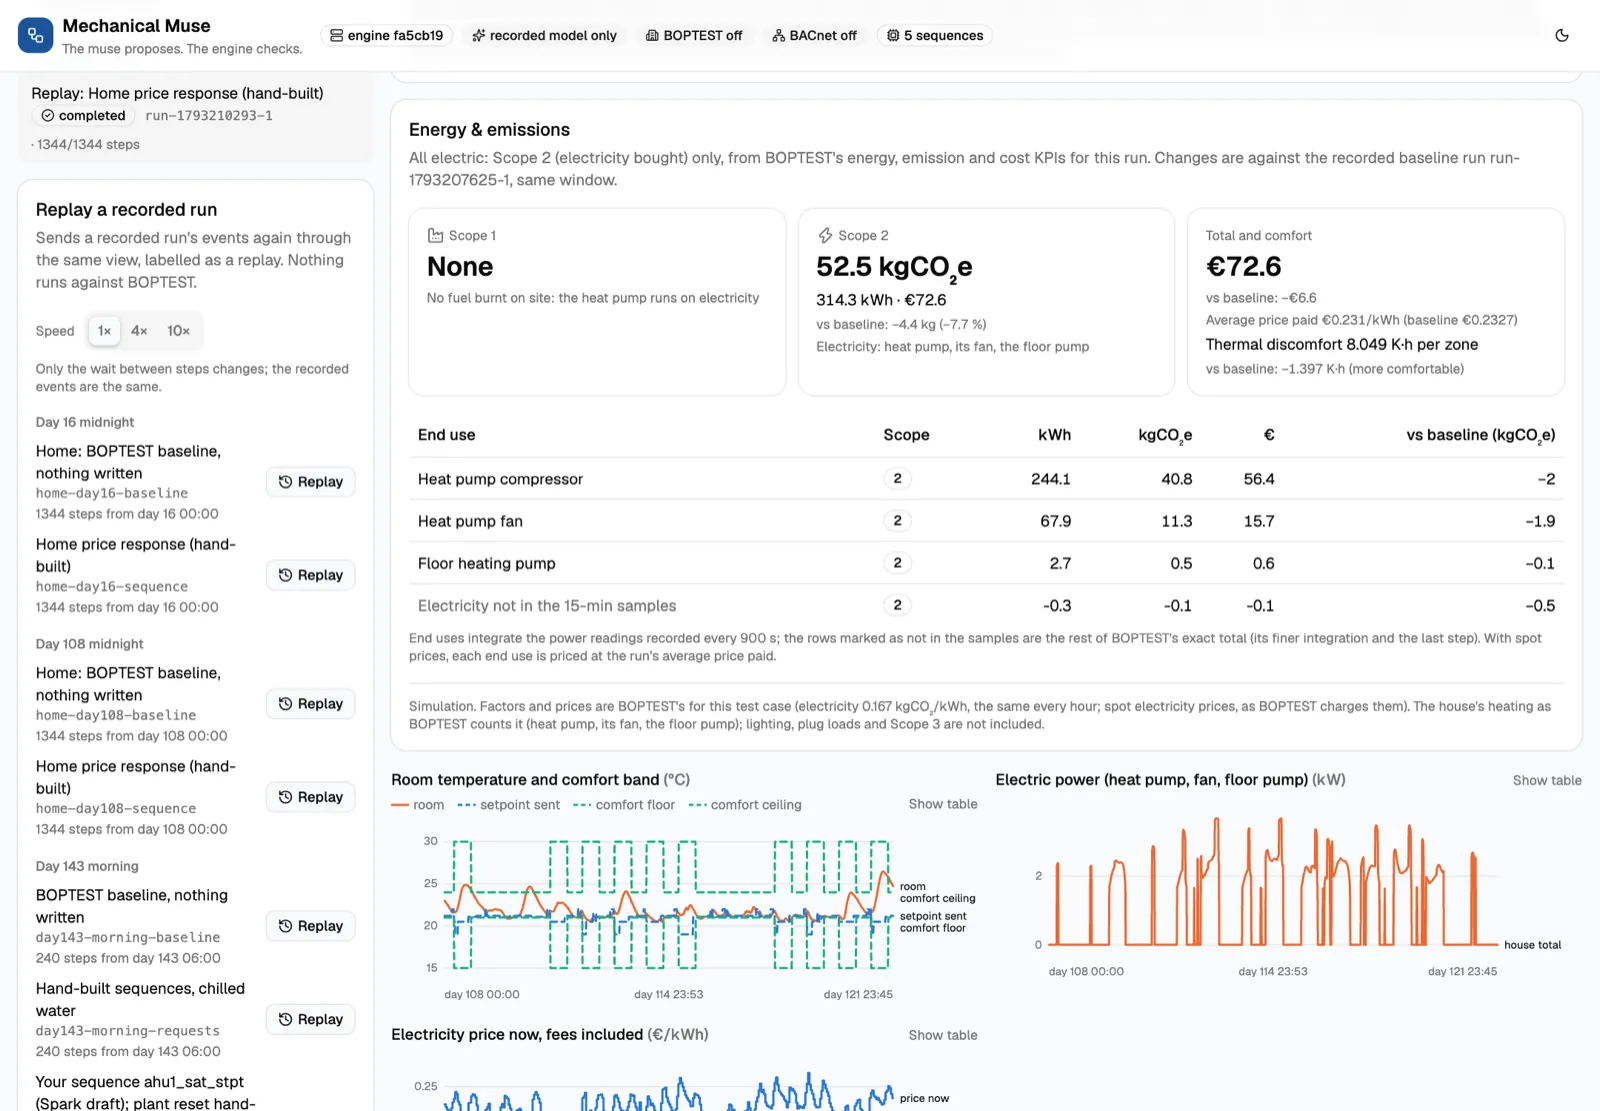
Section titled “The home”The heat pump house has its own basis of BOPTEST’s constants: all electric (no Scope 1), one emission factor all year (0.167 kgCO2/kWh), 192 m2, and spot prices in euros. Its cost is BOPTEST’s own, and the check is that its emissions equal the energy times the factor.
What this is not
Section titled “What this is not”- A simulation, not an inventory. BOPTEST’s emulated building and weather over a chosen window, not metered data and not a GHG report.
- BOPTEST’s average factors, not a utility’s or a grid’s marginal emissions.
- HVAC only, Scopes 1 and 2 only. No lighting or plug loads, no refrigerant leakage, no Scope 3.
Muse Spark’s run explanations get the ledger as given facts and are told to quote, not compute. A reply that states a number not in its input is sent back once, then refused.
Learn more
Section titled “Learn more”- docs/emissions.md: formulas, signals, factors with their BOPTEST source files, and the API routes.