Runtime results
Test case multizone_office_complex_air (BOPTEST v0.9.0) unless stated, 120 s steps, one-day
warm-up.
Chilled-water plant reset with air handler requests
Section titled “Chilled-water plant reset with air handler requests”2026-10-27. Day 185 (a Monday) from 12:00, 300 steps (10 h). Three verified air handler request sequences feed the verified plant reset.
| Over the 10 h window | Baseline | Plant reset with requests | Change |
|---|---|---|---|
BOPTEST ener_tot (kWh/m², whole building) |
0.3255 | 0.3101 | −4.7% |
BOPTEST cost_tot |
0.0227 | 0.0213 | −6.2% |
BOPTEST emis_tot |
0.0930 | 0.0879 | −5.6% |
BOPTEST tdis_tot (thermal discomfort, K·h/zone) |
0.1534 | 0.1564 | +2.0% |
| Chiller energy (kWh, from 120 s power samples) | 4,710 | 4,042 | −14.2% |
| CHW pump energy (kWh, same method) | 2,300 | 2,352 | +2.2% |
What it does not show: one summer afternoon and evening; thermal discomfort rose 2 %; the pressure half saved no pump energy (the saving is at the chillers).
Muse Spark’s drafts, 2026-10-27. Two plant reset graphs drafted by Muse Spark (one from the
recorded session, one from a live session) ran in place of our hand-built graph over the same
window. Both gave setpoint writes and KPIs identical to the hand-built graph’s run (ener_tot
0.3101). That is identical behavior on this window, not equivalence in general.
First live run, 2026-10-26. Day 185 from 05:30, 4 hours, request count fixed at 0: energy −5.4 %, chiller energy −18 %, thermal discomfort no worse. One summer morning, not a season.
Fail-safe, live
Section titled “Fail-safe, live”2026-10-27. Day 186 from 00:00, 60 steps, with floor 1’s supply air temperature replaced by NaN for steps 20 to 24 (a labeled test fault). On each faulted step the reading showed as no data, the floor 1 request sequence and the plant reset went degraded, and both chilled-water setpoints were handed back to BOPTEST’s own controllers. From step 25 the reset wrote again.
Duct static pressure reset
Section titled “Duct static pressure reset”2026-10-27. Same 10 h window, adding 15 zone request sequences and a static pressure reset per floor.
| Over the 10 h window, vs BOPTEST’s baseline | Chilled-water reset only | + static pressure v1 | + static pressure v2 |
|---|---|---|---|
BOPTEST ener_tot |
−4.7% | −33.6% | −24.1% |
BOPTEST cost_tot |
−6.2% | −34.1% | −24.2% |
BOPTEST emis_tot |
−5.6% | −33.9% | −24.2% |
BOPTEST tdis_tot (thermal discomfort) |
+2.0% | +8.9% | −42.1% |
BOPTEST idis_tot (CO2 discomfort) |
no change | +51.4% | +17.4% |
Version 1 starved the zones: no zone ever asked, so the reset trimmed to 50 Pa and saved energy by under-ventilating. Version 2 asks from the airflow shortfall and settled near 165 to 215 Pa. What it does not show: one afternoon, and v2’s 90 % level was chosen after seeing v1 fail on this same window; v2 still costs CO2 comfort.
Bring your own sequence: revision B
Section titled “Bring your own sequence: revision B”2026-10-27. The workbench’s sample sheet (an AHU supply-air temperature reset), read from a photo, drafted, bound and run on three floors beside our own sequences. Revision A’s humidity thresholds latched its override on, so its reset never acted. Revision B raised them.
| Day 143, 06:00, 8 h, against baseline | Energy | Cost | Emissions | Thermal discomfort |
|---|---|---|---|---|
| Our sequences alone | −3.3 % | −5.3 % | −4.3 % | +0.5 % |
| + revision A | −0.7 % | −3.4 % | −2.1 % | +6.7 % |
| + revision B | −37.3 % | −27.9 % | −32.5 % | −10.7 % |
Revision B’s thresholds were chosen after revision A failed on day 143, so it was then run on five windows it was not tuned on:
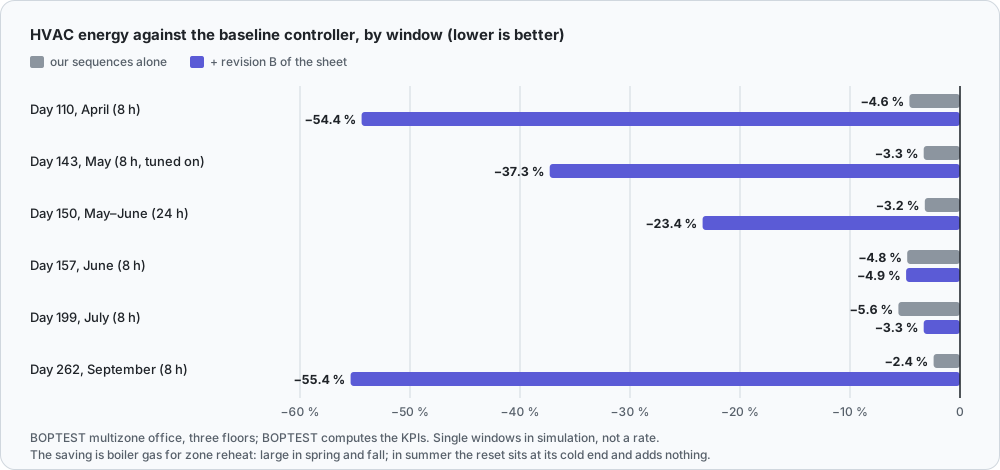
| Window | Our sequences alone | + revision B | Thermal discomfort, + revision B |
|---|---|---|---|
| Day 110 (April), 06:00, 8 h | −4.6 % | −54.4 % | −48.5 % |
| Day 143 (May), 06:00, 8 h (tuned on) | −3.3 % | −37.3 % | −10.7 % |
| Day 150 (late May), 00:00, 24 h | −3.2 % | −23.4 % | −66.0 % |
| Day 157 (June), 06:00, 8 h | −4.8 % | −4.9 % | −9.4 % |
| Day 199 (July), 06:00, 8 h | −5.6 % | −3.3 % | +7.8 % |
| Day 262 (September), 06:00, 8 h | −2.4 % | −55.4 % | −76.2 % |
The saving is mostly boiler gas: a warmer supply air needs far less reheat at the zones. In summer the outdoor air is above the reset band, so the sheet’s reset adds nothing, and on day 199 it did slightly worse than our sequences alone. Single windows in simulation.
What a fault costs
Section titled “What a fault costs”2026-10-27. Day 185 from noon, 10 h, floor 1’s supply-air reading biased 4 K high for 2 h, against the same run without the fault: +130 kWh, +44 kgCO2e and +$12.25, nearly all chiller electricity, about a fifth of the ten hours’ saving. One window, one fault. See the Emissions ledger.
Home price response, live
Section titled “Home price response, live”2026-10-28. The verified graph through mm-runtime (building: home) on BOPTEST’s heat pump
house, spot prices, two weeks of 15-minute steps after a week of warm-up, against BOPTEST’s own
controller. Each step the runtime passes BOPTEST’s forecast in as readings; the graph decides.
| Window | Cost | Energy | Thermal discomfort | Power, most expensive quarter of prices | BOPTEST peak demand KPI |
|---|---|---|---|---|---|
| Typical heating (from day 108) | −8.4 % | −7.7 % | −14.8 % | 1.17 → 0.87 kW (−26 %) | +16.4 % |
| Peak heating (from day 16) | −8.3 % | −7.5 % | −81.9 % | 1.63 → 1.03 kW (−37 %) | +3.7 % |
| From day 40 (not tuned on) | −6.9 % | −6.4 % | −45.2 % | 1.44 → 0.96 kW (−34 %) | +6.4 % |
| From day 315 (not tuned on) | −6.0 % | −5.7 % | −71.5 % | 1.57 → 1.20 kW (−24 %) | +5.3 % |
Home price response probe
Section titled “Home price response probe”2026-10-28. BOPTEST’s bestest_hydronic_heat_pump (a home in Brussels), highly dynamic
price, 14-day windows, against BOPTEST’s own controller. The rule was run from the
spec’s Python reference model, not yet the verified graph through the runtime, with a
perfect price forecast.
| Window | Cost | Thermal discomfort | Mean power in the most expensive quarter of 15-min prices |
|---|---|---|---|
| Typical heating (BOPTEST window) | −8.4 % | −14.8 % | 1.17 → 0.85 kW |
| Peak heating (BOPTEST window) | −8.3 % | −81.9 % | 1.68 → 1.04 kW |
| From day 40 (not tuned on) | −6.9 % | −45.2 % | 1.49 → 0.94 kW |
| From day 315 (not tuned on) | −6.0 % | −71.5 % | 1.62 → 1.24 kW |
Energy fell 5.7 to 7.7 %, so part of the cost cut is plain saving. Prices in this building swing little, so the per-home saving is small.
Learn more
Section titled “Learn more”- docs/runtime-results.md: setup, commands, time series and timings.
- docs/workbench.md and docs/emissions.md.
- docs/results-log.md: one line per result or adjustment, including the ones that went badly.